If you're a homeowner or prospective buyer in East Menlo Park, staying informed about the latest real estate market trends is crucial. With the housing market constantly evolving, understanding price movements, inventory levels, and sales dynamics can help you make smarter decisions—whether you're planning to buy, sell, or invest. In this comprehensive update, we'll dive into the current state of East Menlo Park home prices, analyze historical trends, and offer insights into what the future may hold for this exclusive Bay Area neighborhood.
This article is inspired by a detailed market update from Graeham Watts, a trusted local real estate agent, who breaks down the data and shares practical tips for navigating the market. Whether you're new to East Menlo Park or an experienced homeowner, this guide will help you get a clear picture of where things stand in May 2025.
Table of Contents
- 📉 Understanding the Current Downward Trend in East Menlo Park Home Prices
- 🏠 Historical Perspective: East Menlo Park Home Prices Since 2019
- ⏳ Days on Market and What It Means for Buyers and Sellers
- 📉 Why Some Data Points May Appear Incomplete or Skewed
- 📞 What This Means for Buyers and Sellers in East Menlo Park
- 🔮 Looking Ahead: What’s Next for East Menlo Park Home Prices?
- ❓ Frequently Asked Questions About East Menlo Park Home Prices
- 📞 Connect with a Trusted East Menlo Park Real Estate Expert
📉 Understanding the Current Downward Trend in East Menlo Park Home Prices
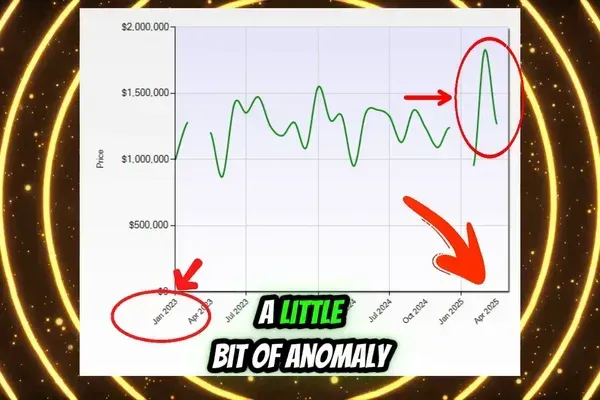
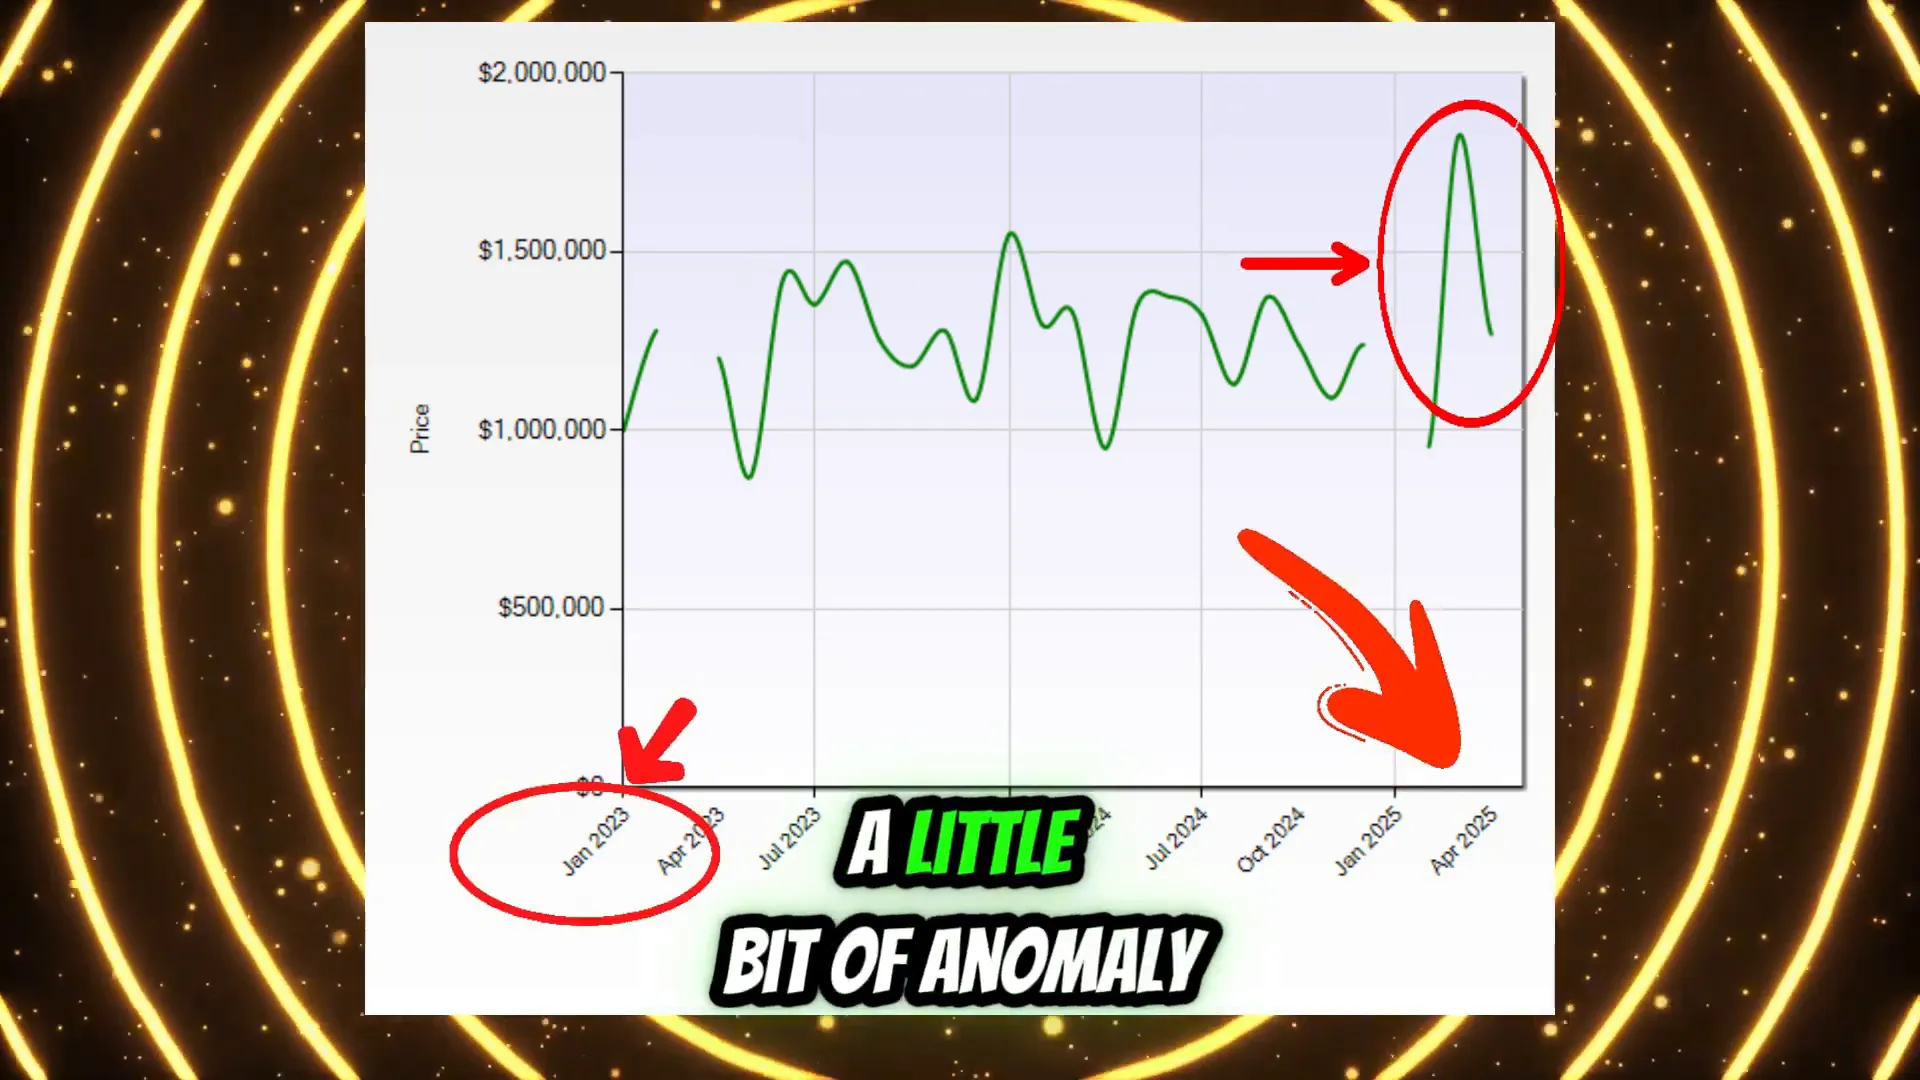
When we look back at the home price trends in East Menlo Park from early 2023 to today, one noticeable pattern is a slight downward trend in pricing. After a significant peak in home prices, we are seeing prices gradually ease off. However, it’s important to understand the context of this peak—it was somewhat of an anomaly.
East Menlo Park is known for its tight inventory, meaning there are very few homes available for sale at any given time. Because of this scarcity, the sales of even a single home can dramatically influence market statistics. For example, if there are only two homes on the market and one sells for a price well above the usual range, it causes a spike in average prices that may not reflect the broader market reality.
This phenomenon explains the sharp peak you might notice in the pricing graph, but it doesn’t necessarily indicate a sustained upward trend. Instead, it highlights the sensitivity of the market metrics to small changes in inventory and sales prices.
🏠 Historical Perspective: East Menlo Park Home Prices Since 2019
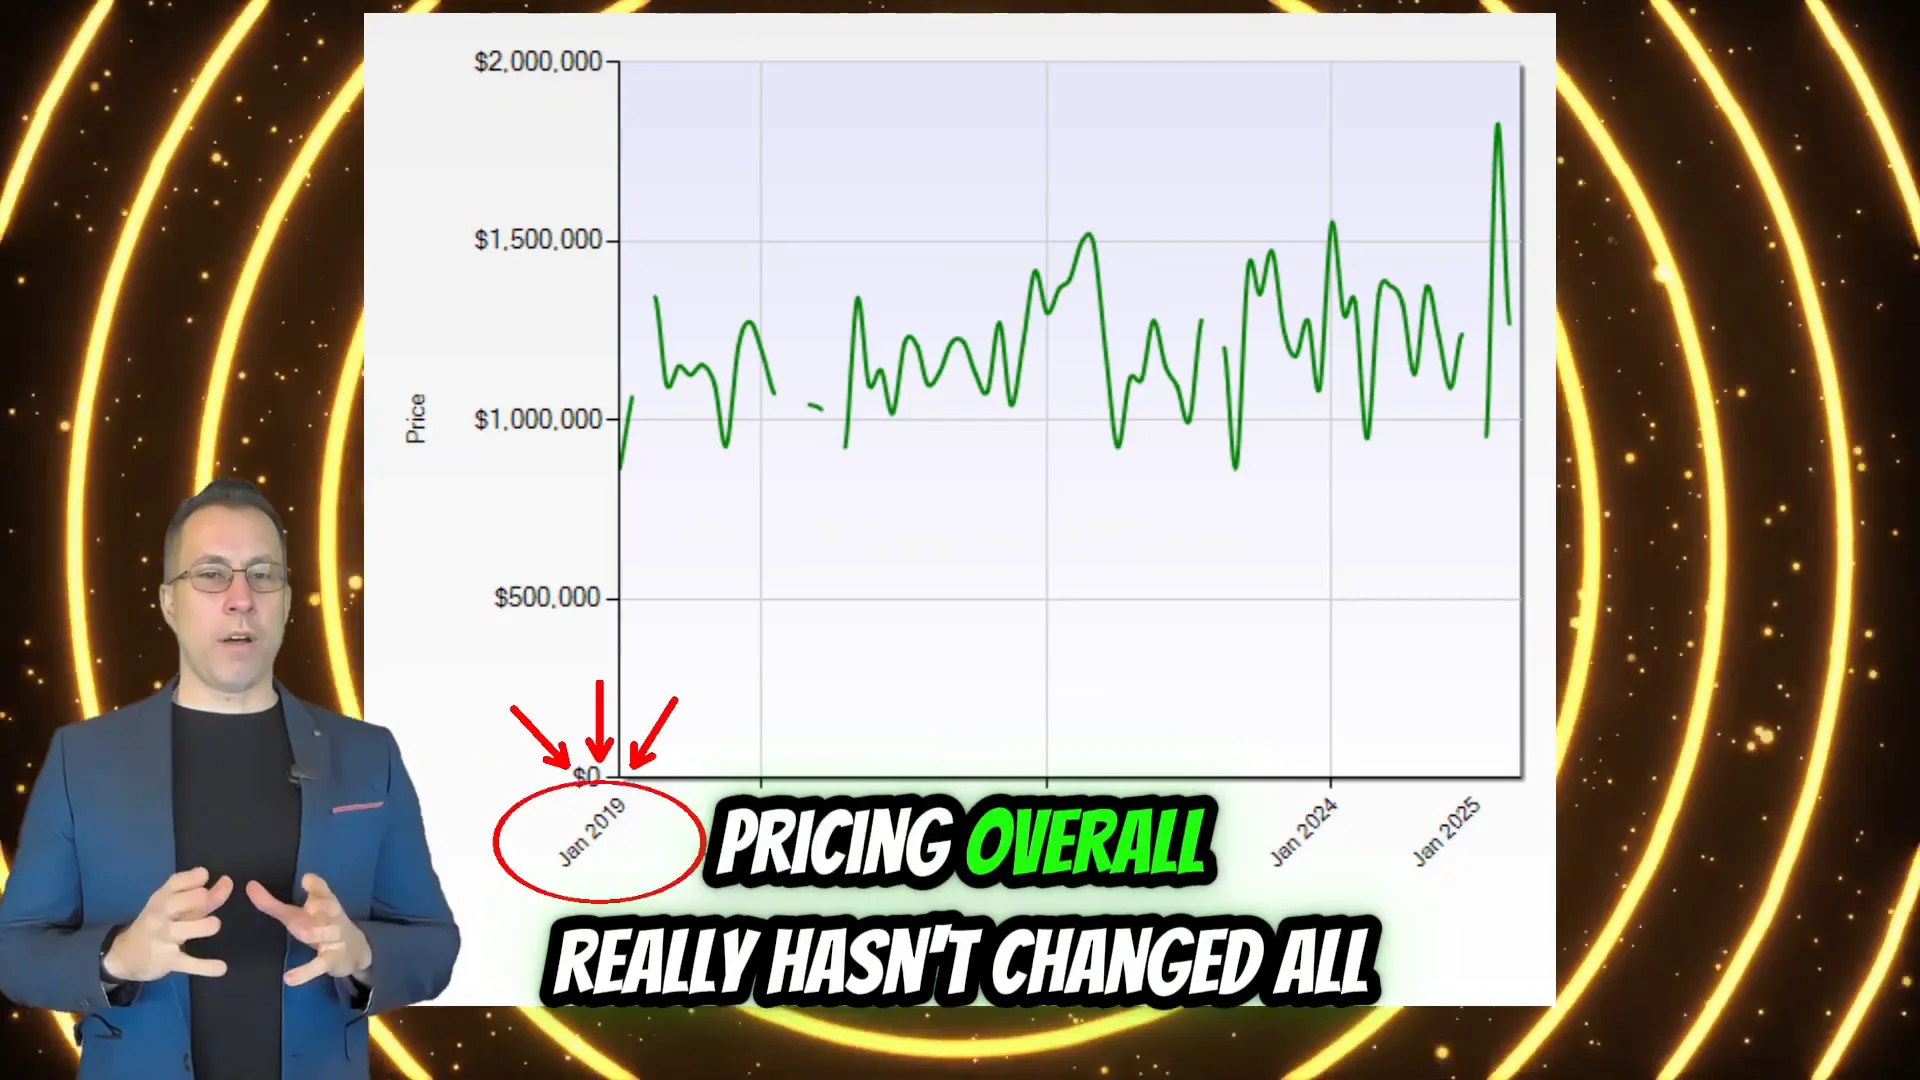
To gain a better sense of the market’s stability, it’s useful to extend our view further back in time. Looking at East Menlo Park home prices since 2019, we observe that prices have remained relatively steady over the years. The market hasn’t experienced dramatic fluctuations but rather a horizontal movement—prices have moved "from left to right," maintaining a consistent level.
This stability suggests a mature market where home values don’t wildly swing but hold their value over time. Such consistency is reassuring for homeowners who want to know their investment is stable, and for buyers seeking predictable pricing.
While housing markets in other parts of the country have seen wild swings due to economic changes, interest rates, or supply shocks, East Menlo Park’s market has demonstrated resilience. The demand for homes in this desirable Bay Area neighborhood remains strong, but the limited inventory keeps prices from spiking or dropping too much.
⏳ Days on Market and What It Means for Buyers and Sellers
One key metric to watch in real estate is the average number of days a home stays on the market before selling. For East Menlo Park, this number has remained fairly consistent month-to-month. Currently, the average days on market hovers around 40 days according to the data, but that figure can be misleading due to the limited sample size.
